22. Data Displays, Mean, Median, Mode, Range, and Weighted Reasoning
GED® Math Basics · preview lesson
22. Data Displays, Mean, Median, Mode, Range, and Weighted Reasoning
Learning goals
- Calculate and interpret mean, median, mode, and range.
- Find missing values and combined means.
- Read bar charts, line graphs, and tables.
- Explain the effect of outliers and sample sizes.
Entry retrieval and orientation
Retrieve arithmetic operations and rate of change. Estimate the center by locating the data's visual middle before calculating.
Begin without notes. Spend three to five minutes writing what you remember, even if the first attempt is incomplete. Retrieval is useful because it reveals what is available from memory rather than what merely feels familiar on the page. After the attempt, compare it with the lesson and correct it in a different color. Keep the correction specific: identify the decision, operation, sign, unit, or interpretation that needs attention.
Why this session matters
Statistics summarizes data without erasing context. Measures of center answer different questions, range describes spread, and graphs can support or distort conclusions depending on scale. A defensible interpretation identifies both the calculation and what it represents.
Mathematical readiness includes more than producing a number. A complete solution states what is known, what is being asked, which relationship connects those quantities, how the calculation proceeds, and why the result is reasonable. Throughout this session, read units as part of the mathematics. When a context changes, preserve the underlying relationship while adapting the representation.
Visual model
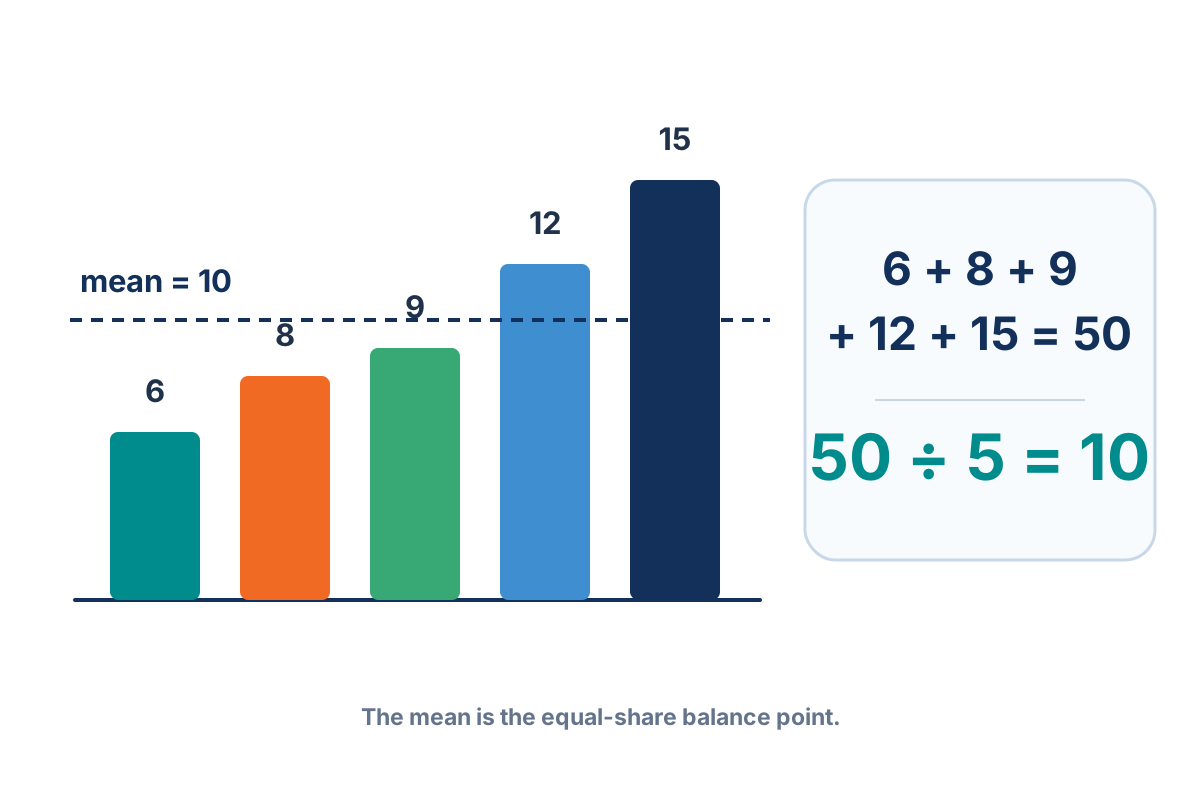
How to read this visual. The values total 50, and there are 5 observations. Dividing 50 by 5 places the mean line at 10, the balance point of the data set.
Core lesson
Core idea 1. The mean redistributes the total equally: sum divided by count. It uses every value and is sensitive to extreme observations.
Core idea 2. The median is the ordered middle and resists outliers. With an even count, average the two middle values. The mode is the most frequent value and may be absent or nonunique.
Core idea 3. Range is maximum minus minimum and describes total spread, not a typical value. More detailed spread measures exist, but range is a quick first comparison.
Core idea 4. Combined means must be weighted by group size. Convert each group mean back to a total, add totals, and divide by the combined count. Graph interpretation must respect axes, intervals, and units.
These ideas work together. Do not treat a formula or procedure as an isolated password. Ask what each number represents, which values may legitimately be combined, and what must remain invariant while the calculation changes form. A method becomes transferable when you can explain both what to do and why the step preserves the quantity or relationship in the problem.
A reliable problem-solving method
- Identify what each value and unit represents.
- Order data when finding median, mode, or range.
- For a mean, compute or reconstruct the total and count.
- Read graph scales before extracting values.
- Interpret the statistic in a complete sentence and inspect outliers.
Before calculating, make a rough prediction. The prediction may concern sign, magnitude, direction of change, position on a graph, or the power on a unit. After calculating, compare the exact result with that prediction. If they disagree, pause and inspect the setup before repeating the same keystrokes. A second method—substitution, inverse operation, alternate representation, or bounding estimate—provides stronger evidence than simply repeating one procedure.
Connect multiple representations
- Lists and frequency tables expose order and repetition.
- Bar charts compare categories; line graphs show change across an ordered axis.
- Dot plots reveal clusters, gaps, and outliers that a single average can hide.
Practice translating among words, symbols, tables, diagrams, and graphs. Translation is not an optional decoration: it often exposes information that is hard to see in the original form. Describe what stays the same across representations. For example, a rate remains the same comparison whether it appears as a verbal 'per' statement, a fraction with units, a table pattern, a graph slope, or a coefficient in an equation.
Ten fully worked examples
The examples begin with focused practice and become more mixed. For each one, pause after reading the problem and write a plan before revealing the solution. Then cover the completed work and reproduce it from a blank page. The goal is to learn a decision process, not to memorize the displayed numbers.
Worked example 1
Problem. Find the mean of 6, 8, 9, 12, and 15.
Answer. 10
Plan. Choose the statistic or graph feature that matches the question, calculate with totals and counts, and interpret its meaning and limitations. In this example, identify the quantities and explain why this relationship fits before doing arithmetic.
Calculation. Add the values to get 50, then divide by 5 values: 50/5 = 10.
Verification. Five groups of the mean 10 total 50.
Self-explanation prompt. Cover the solution and reproduce it. Then name the first decision that made the remaining calculation possible, and explain why one tempting alternative method would fail.
Worked example 2
Problem. Find the median of 3, 11, 7, 5, 20.
Answer. 7
Plan. Choose the statistic or graph feature that matches the question, calculate with totals and counts, and interpret its meaning and limitations. In this example, identify the quantities and explain why this relationship fits before doing arithmetic.
Calculation. Order the data: 3, 5, 7, 11, 20. The middle value is 7.
Verification. There are two values below and two above 7.
Self-explanation prompt. Cover the solution and reproduce it. Then name the first decision that made the remaining calculation possible, and explain why one tempting alternative method would fail.
Worked example 3
Problem. Find the median of 4, 7, 9, 12, 18, 21.
Answer. 10.5
Plan. Choose the statistic or graph feature that matches the question, calculate with totals and counts, and interpret its meaning and limitations. In this example, identify the quantities and explain why this relationship fits before doing arithmetic.
Calculation. With six ordered values, average the two middle values: (9 + 12)/2 = 10.5.
Verification. Three values are at or below the midpoint pair and three at or above.
Self-explanation prompt. Cover the solution and reproduce it. Then name the first decision that made the remaining calculation possible, and explain why one tempting alternative method would fail.
Worked example 4
Problem. Find the mode of 2, 5, 5, 7, 8, 8, 8, 10.
Answer. 8
Plan. Choose the statistic or graph feature that matches the question, calculate with totals and counts, and interpret its meaning and limitations. In this example, identify the quantities and explain why this relationship fits before doing arithmetic.
Calculation. The mode is the most frequent value. Eight appears three times, more than any other value.
Verification. Counting frequencies confirms only 8 occurs three times.
Self-explanation prompt. Cover the solution and reproduce it. Then name the first decision that made the remaining calculation possible, and explain why one tempting alternative method would fail.
Worked example 5
Problem. Find the range of 14, 3, 19, 8, 11.
Answer. 16
Plan. Choose the statistic or graph feature that matches the question, calculate with totals and counts, and interpret its meaning and limitations. In this example, identify the quantities and explain why this relationship fits before doing arithmetic.
Calculation. Range equals maximum minus minimum: 19 - 3 = 16.
Verification. The range measures the full distance from 3 to 19.
Self-explanation prompt. Cover the solution and reproduce it. Then name the first decision that made the remaining calculation possible, and explain why one tempting alternative method would fail.
Worked example 6
Problem. The mean of four test scores is 82. Three scores are 78, 85, and 91. Find the fourth.
Answer. 74
Plan. Choose the statistic or graph feature that matches the question, calculate with totals and counts, and interpret its meaning and limitations. In this example, identify the quantities and explain why this relationship fits before doing arithmetic.
Calculation. Total points must be 4 x 82 = 328. Known scores total 254, so the missing score is 328 - 254 = 74.
Verification. Adding 74 gives total 328 and mean 82.
Self-explanation prompt. Cover the solution and reproduce it. Then name the first decision that made the remaining calculation possible, and explain why one tempting alternative method would fail.
Worked example 7
Problem. A data set is 10, 11, 12, 13, 14. If 14 is replaced by 40, which measure changes most?
Answer. The mean
Plan. Choose the statistic or graph feature that matches the question, calculate with totals and counts, and interpret its meaning and limitations. In this example, identify the quantities and explain why this relationship fits before doing arithmetic.
Calculation. The outlier 40 enters the sum directly, raising the mean from 12 to 17.2. The median remains 12.
Verification. Means are sensitive to extreme values; medians are resistant.
Self-explanation prompt. Cover the solution and reproduce it. Then name the first decision that made the remaining calculation possible, and explain why one tempting alternative method would fail.
Worked example 8
Problem. A bar chart shows sales of 12, 18, 15, and 25 units over four weeks. What is the total?
Answer. 70 units
Plan. Choose the statistic or graph feature that matches the question, calculate with totals and counts, and interpret its meaning and limitations. In this example, identify the quantities and explain why this relationship fits before doing arithmetic.
Calculation. Add all bar values: 12 + 18 + 15 + 25 = 70 units.
Verification. The average is 17.5, and 17.5 x 4 also gives total 70.
Self-explanation prompt. Cover the solution and reproduce it. Then name the first decision that made the remaining calculation possible, and explain why one tempting alternative method would fail.
Worked example 9
Problem. A line graph rises from 240 users in March to 330 in June. What is the average monthly increase across the three intervals?
Answer. 30 users per month
Plan. Choose the statistic or graph feature that matches the question, calculate with totals and counts, and interpret its meaning and limitations. In this example, identify the quantities and explain why this relationship fits before doing arithmetic.
Calculation. Total increase is 330 - 240 = 90 across March-April, April-May, and May-June: three intervals. Divide 90/3 = 30.
Verification. Three monthly increases of 30 total 90.
Self-explanation prompt. Cover the solution and reproduce it. Then name the first decision that made the remaining calculation possible, and explain why one tempting alternative method would fail.
Worked example 10
Problem. Group A has 20 values with mean 70. Group B has 30 values with mean 80. Find the combined mean.
Answer. 76
Plan. Choose the statistic or graph feature that matches the question, calculate with totals and counts, and interpret its meaning and limitations. In this example, identify the quantities and explain why this relationship fits before doing arithmetic.
Calculation. Use weighted totals: A contributes 20 x 70 = 1,400; B contributes 30 x 80 = 2,400. Total 3,800/50 = 76.
Verification. The combined mean is closer to 80 because Group B is larger.
Self-explanation prompt. Cover the solution and reproduce it. Then name the first decision that made the remaining calculation possible, and explain why one tempting alternative method would fail.
Common mistakes and how to repair them
- Mistake: Finding median before ordering Correction: Sort the data first. Write a one-sentence reason the correction is mathematically valid, not merely a rule to memorize.
- Mistake: Averaging two group means without group sizes Correction: Weight each mean by its count. Write a one-sentence reason the correction is mathematically valid, not merely a rule to memorize.
- Mistake: Reading bar height without the axis scale Correction: Check the baseline and interval labels. Write a one-sentence reason the correction is mathematically valid, not merely a rule to memorize.
An error log should record the first point where correct reasoning diverged, not only the final wrong answer. Classify the error as interpretation, representation, formula choice, operation, sign, substitution, arithmetic, unit, rounding, or final-answer communication. Then rewrite the problem with one change in numbers and solve it correctly. This turns feedback into a reusable prevention habit.
Adult-life transfer
This session's reasoning appears in:
- test scores and production
- surveys and budgets
- trend reports and performance comparisons
For one application, create your own realistic values and state any assumptions. Solve it, then change one condition and predict how the answer should change before recalculating. This variation step distinguishes genuine understanding from imitation. A strong model also acknowledges constraints: counts may need whole numbers, lengths cannot be negative, spending cannot exceed a budget, and reported precision should match the given data.
Independent practice and spaced review
Use a three-pass routine. On the first pass, complete two near examples immediately after study so the new method is stable. On the second pass, wait until later the same day and solve two problems without notes. On the third pass, return after at least one day and mix this topic with earlier sessions so the method is not announced. Mark confidence before checking; high confidence paired with an error deserves special attention because it signals a misconception rather than a simple lapse.
Build a six-item retrieval set: two direct problems from this session, two application problems with unfamiliar wording, and two cumulative problems from earlier sessions. For every missed item, study the explanation briefly, close it, and solve the problem again from the beginning. Do not copy line by line while looking. The second attempt should be a retrieval attempt, and a third parallel problem should confirm that the correction transfers.
Explain one solution aloud as if teaching a learner who chose a common distractor. Name why that distractor is tempting and identify the exact mathematical principle that rejects it. Finally, write a one-minute summary containing the main relationship, a unit or sign check, and one situation in which the method should not be used. This summary becomes the entry retrieval prompt for a later study session.
Mastery checklist
- I can meet each learning goal without copying a worked example.
- I can select the method when the problem does not name the topic.
- I can show a representation, calculation, and verification.
- I can explain one common mistake and repair it.
- I can solve at least twelve of fifteen aligned practice questions and correct every miss.
- I can return after a delay and solve a mixed problem with appropriate units and a complete answer sentence.
No teacher notes have been added for this session.
No additional resources have been added for this session.
Lesson Discussion
Ask a question about this lesson. A teacher or admin can answer here.
Sign in to ask a question or save this lesson.
No questions yet for this lesson.